Want to know if your loyalty program is growing and how your members buy? Analytics brings it together in tabs, and every metric comes with a short definition. Hover over any label with a dotted underline to read it.
Go to Analytics in the app menu. This guide covers the Overview, Members and sales and Points and tiers tabs. For cards, acquisition and campaigns, see Card and Campaign Analytics.
Members and sales and Points and tiers need the JeriCommerce loyalty program. Without it, those tabs show a lock.
Choose the period 
Use the three buttons above the charts:
- Period: last 7, 30 or 90 days, last 12 months (the default) or this year.
- Compare to: previous period, previous year, or no comparison. The arrow next to each figure shows the change: in % for counts and money, and in percentage points (pp) for rates.
- Group by: day, week or month. Automatic picks one from the length of the period.
Data can take up to 5 minutes to update. Dates use your browser's time zone, weeks start on Monday, and the first and last points of a chart can cover a partial week or month.
Overview 
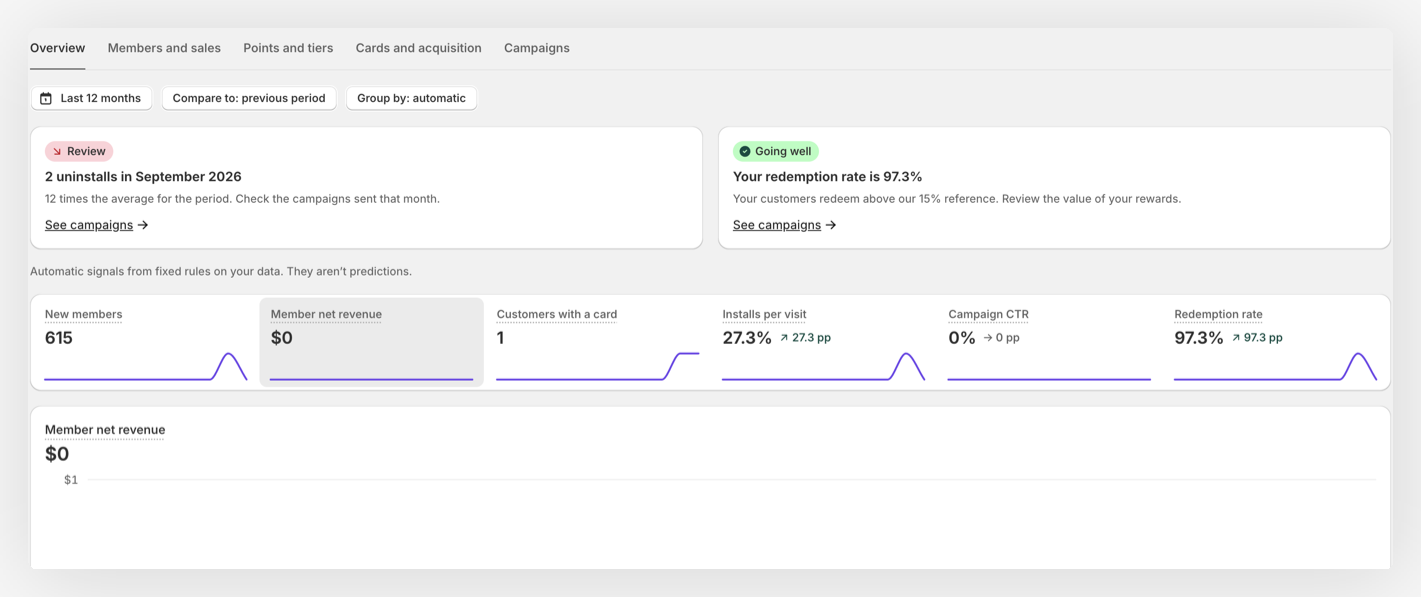
The overview can show New members, Member net revenue, Customers with a card, Installs per visit, Campaign CTR, and Redemption rate. Click a metric to chart it against the comparison period.
Above them, automatic signals flag what changed, such as an uninstall spike or a shift in referred signups. They come from fixed rules on your data, not predictions, and each one links to where you can act.
Members and sales 
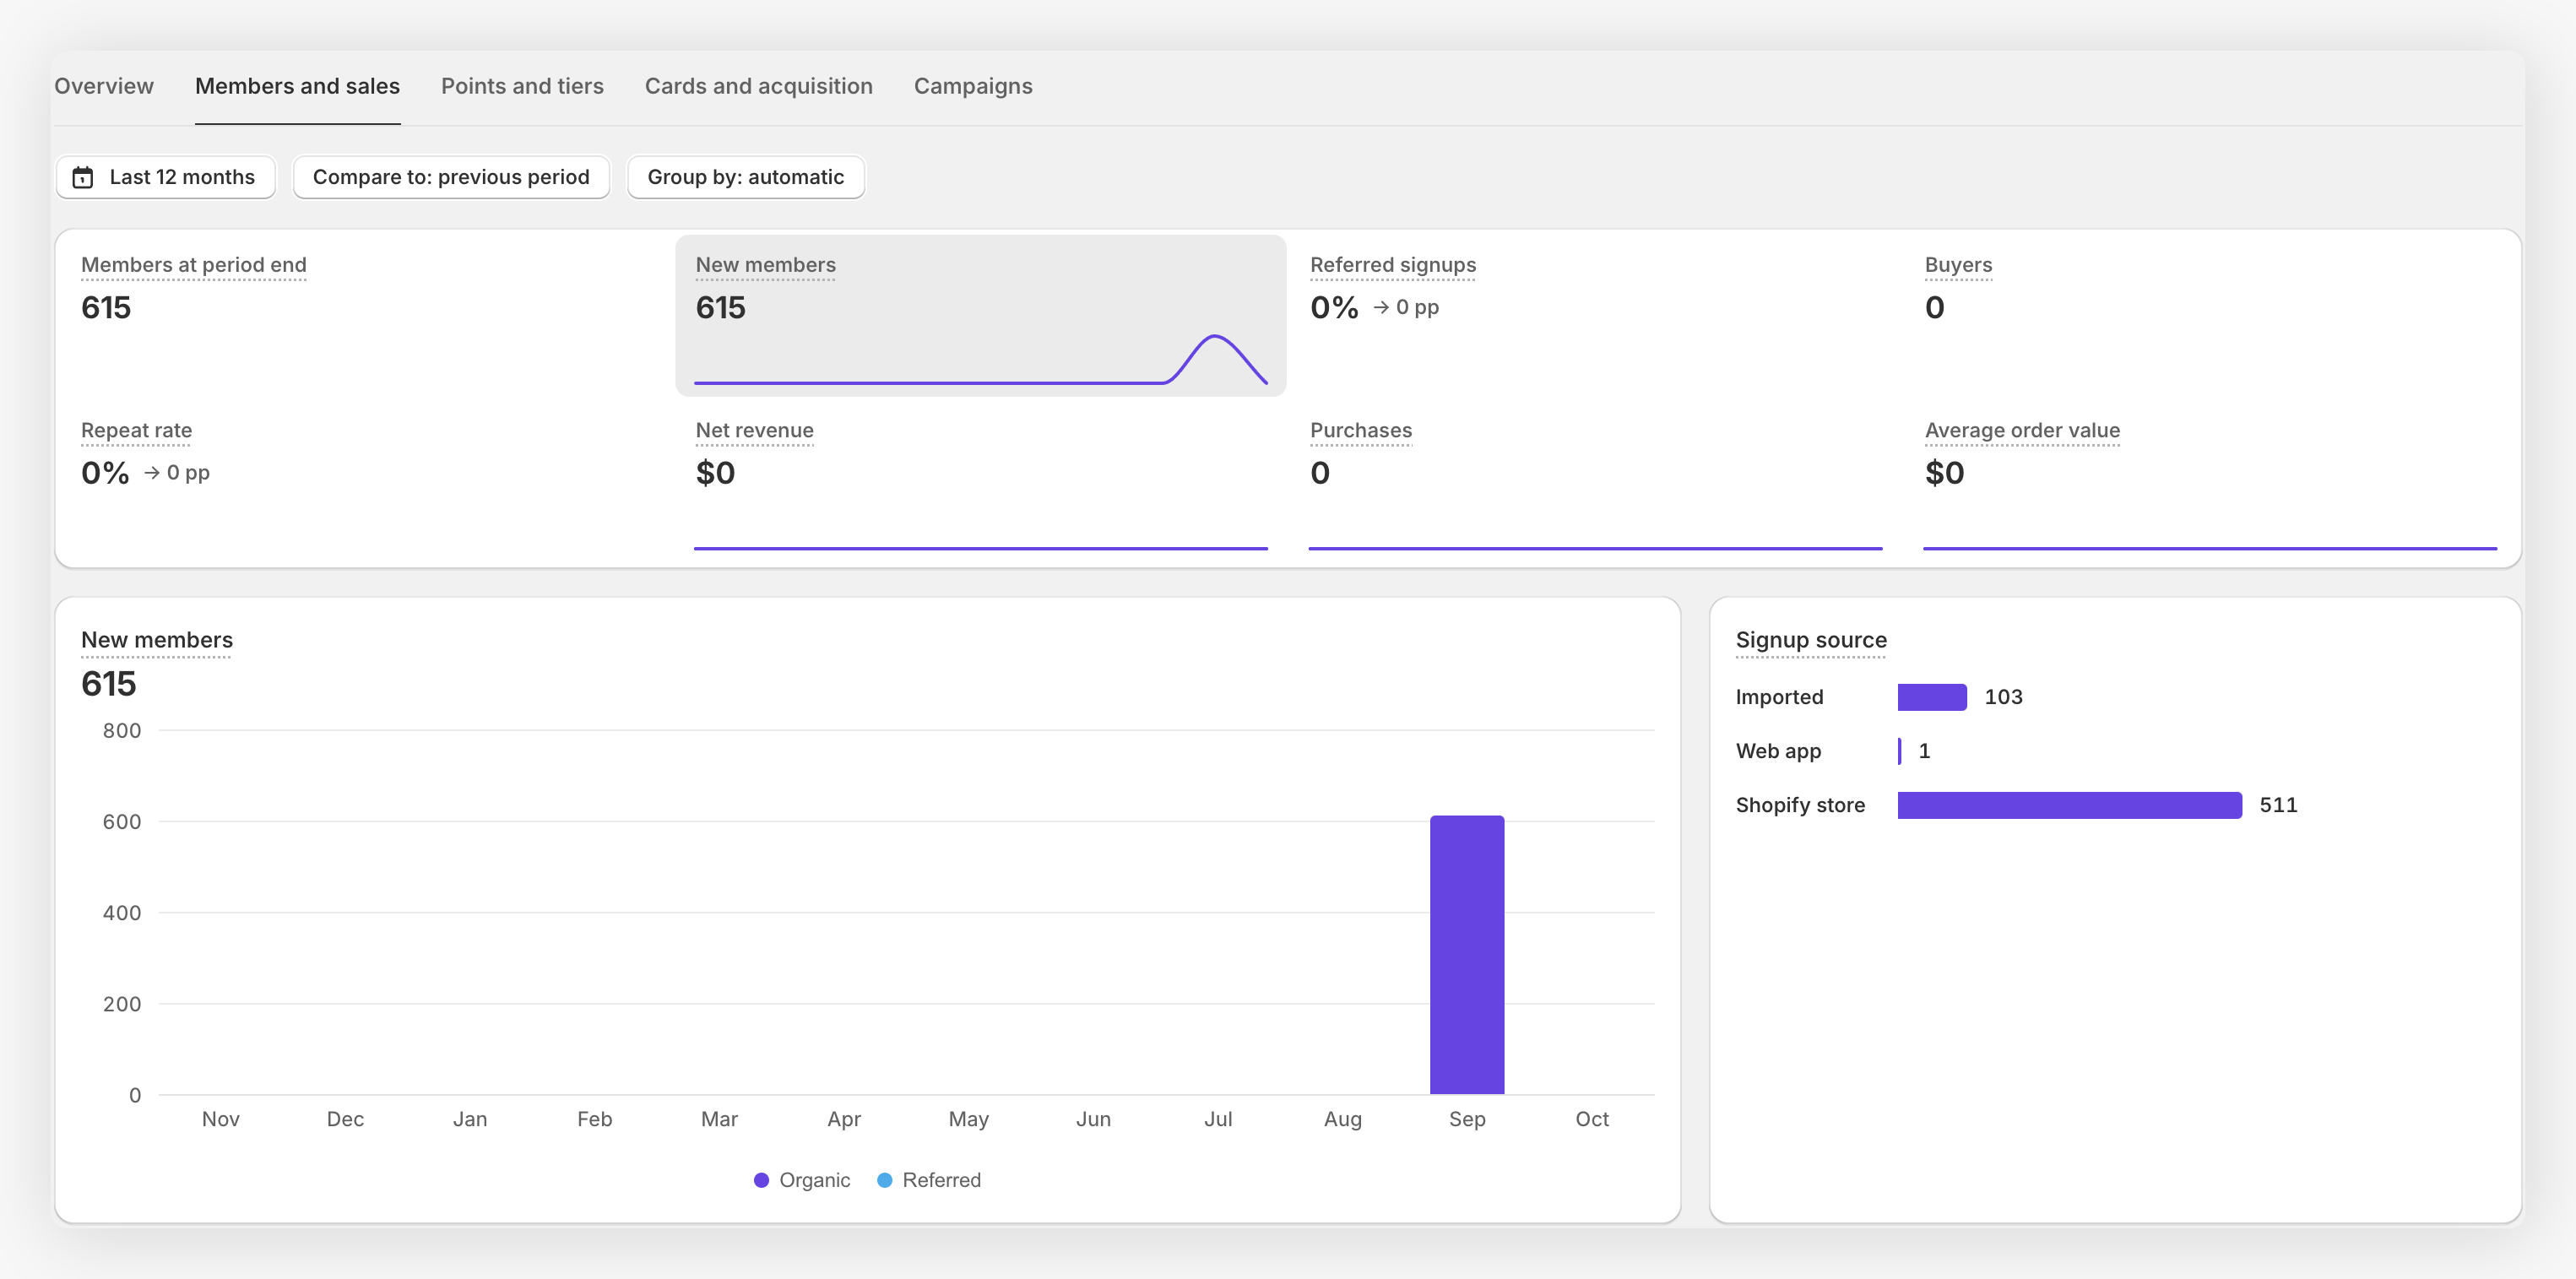
| Metric | What it counts |
|---|---|
| Members at period end | Customers who had joined by the end of the period, with or without a card or purchases. |
| New members | Customers who joined during the period. |
| Referred signups | Share of the period's new members who joined through a referral. |
| Buyers | Members with at least one purchase in the period. |
| Repeat rate | Buyers with two or more purchases in the period. It isn't a retention rate. |
| Net revenue | Processed purchases minus refunds recorded in the period. A refund can belong to an earlier purchase. |
| Purchases | Your members' processed purchases. Refunds don't count. |
| Average order value | Purchase amount before refunds, divided by the number of purchases. |
Below the metrics you'll find new members split into organic and referred, the signup source, the purchase frequency, repeat purchase by cohort and your top referrers.
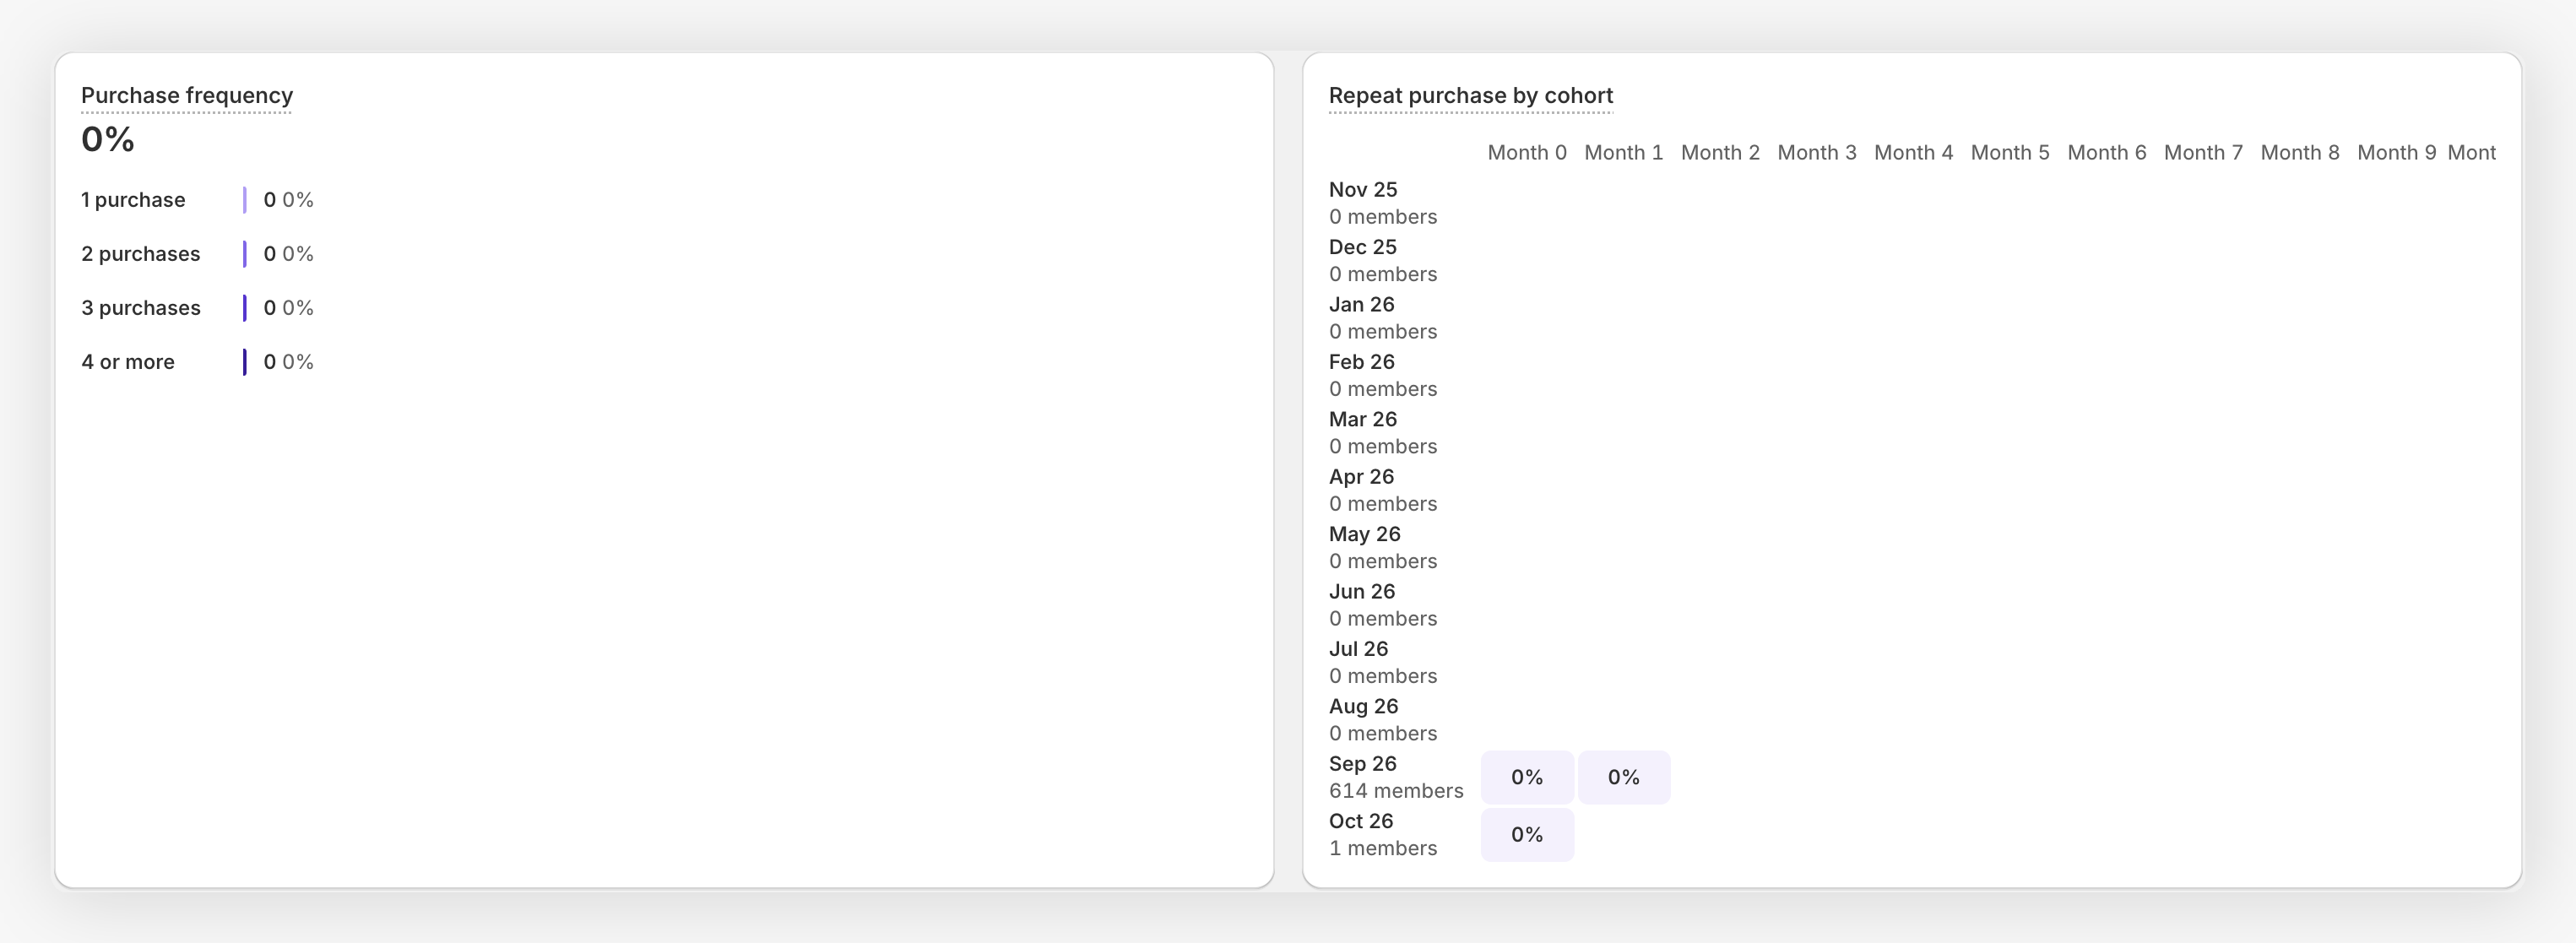
- Repeat purchase by cohort: each row is a signup month, and each cell shows the share of those members who bought in a later month. Each month counts on its own, and the most recent one may be partial.
- Top referrers: the members who brought the most new members. Their revenue is what their referrals bought in the period, before refunds.
Revenue in Analytics is what your members spent, in your program's currency. It isn't extra sales caused by the program, and it doesn't include purchases from customers who aren't members.
Points and tiers 
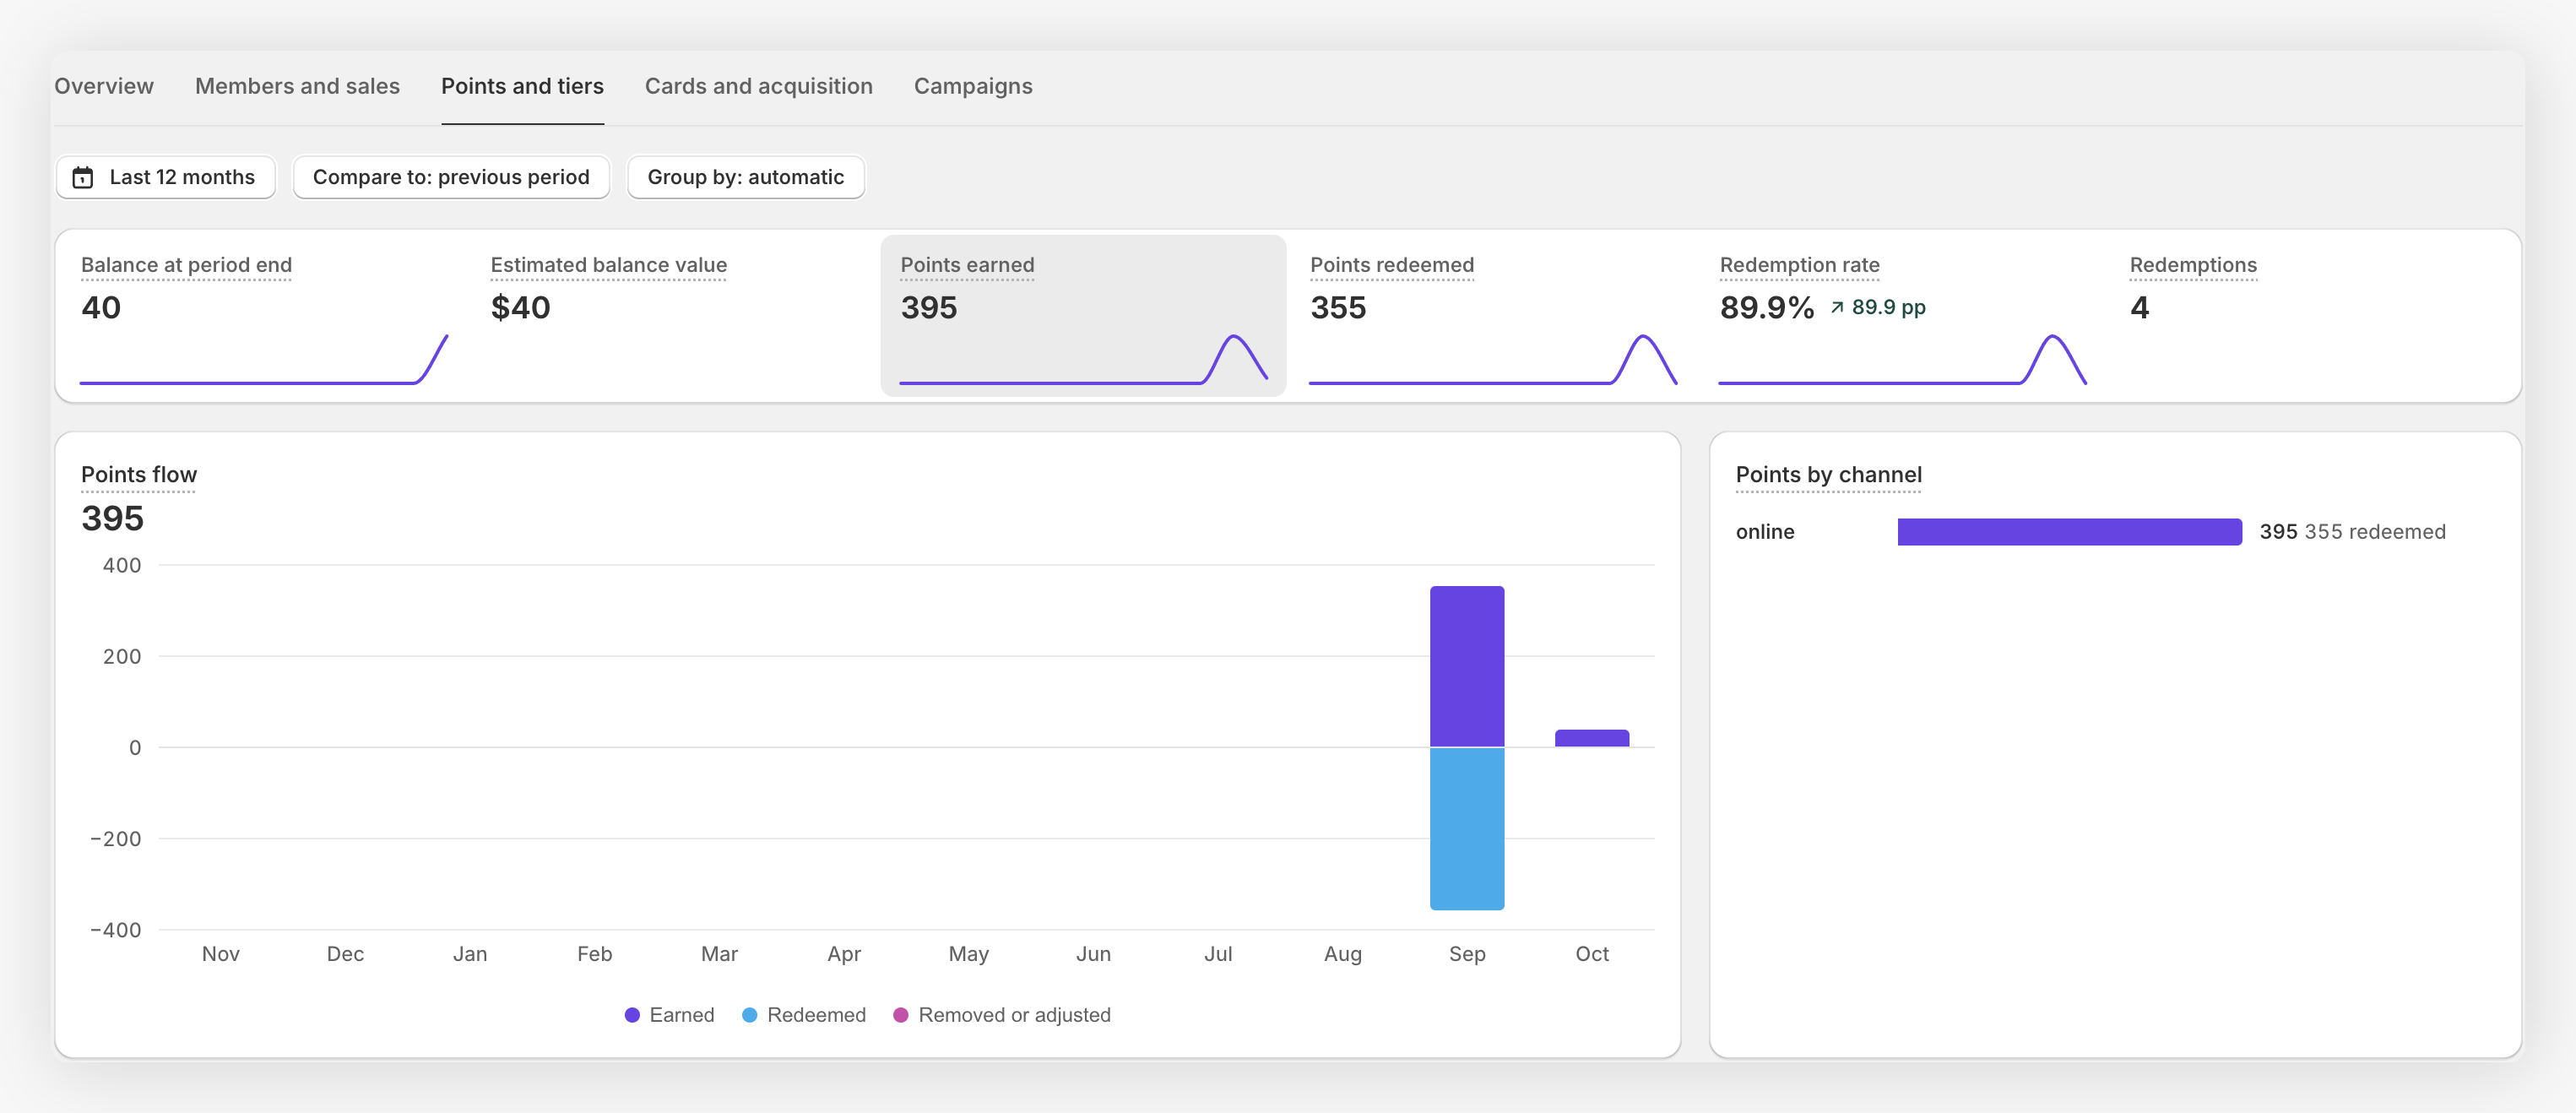
| Metric | What it counts |
|---|---|
| Balance at period end | Unused points at the end of the period. It's points, not money. |
| Estimated balance value | An estimate based on the value per point of the rewards we can value. It isn't a cost or a liability. |
| Points earned | Points given for purchases and actions in the period. |
| Points redeemed | Points spent on rewards, minus the refunds we can identify. |
| Redemption rate | Points redeemed over points earned in the period. It can go above 100% when customers use points they earned earlier. |
| Redemptions | Redemptions in the period, free ones included, minus full cancellations. It can be negative. |
The redemption rate chart shows a band from 13% to 15%. It's our reference, not a market benchmark. A rate well below it usually means customers collect points without using them. Try more attractive rewards or a lower cost in points.
Points flow shows earned points going up and redeemed or removed points going down. Points by channel splits them between your online store and each store location.
Tiers and rewards 
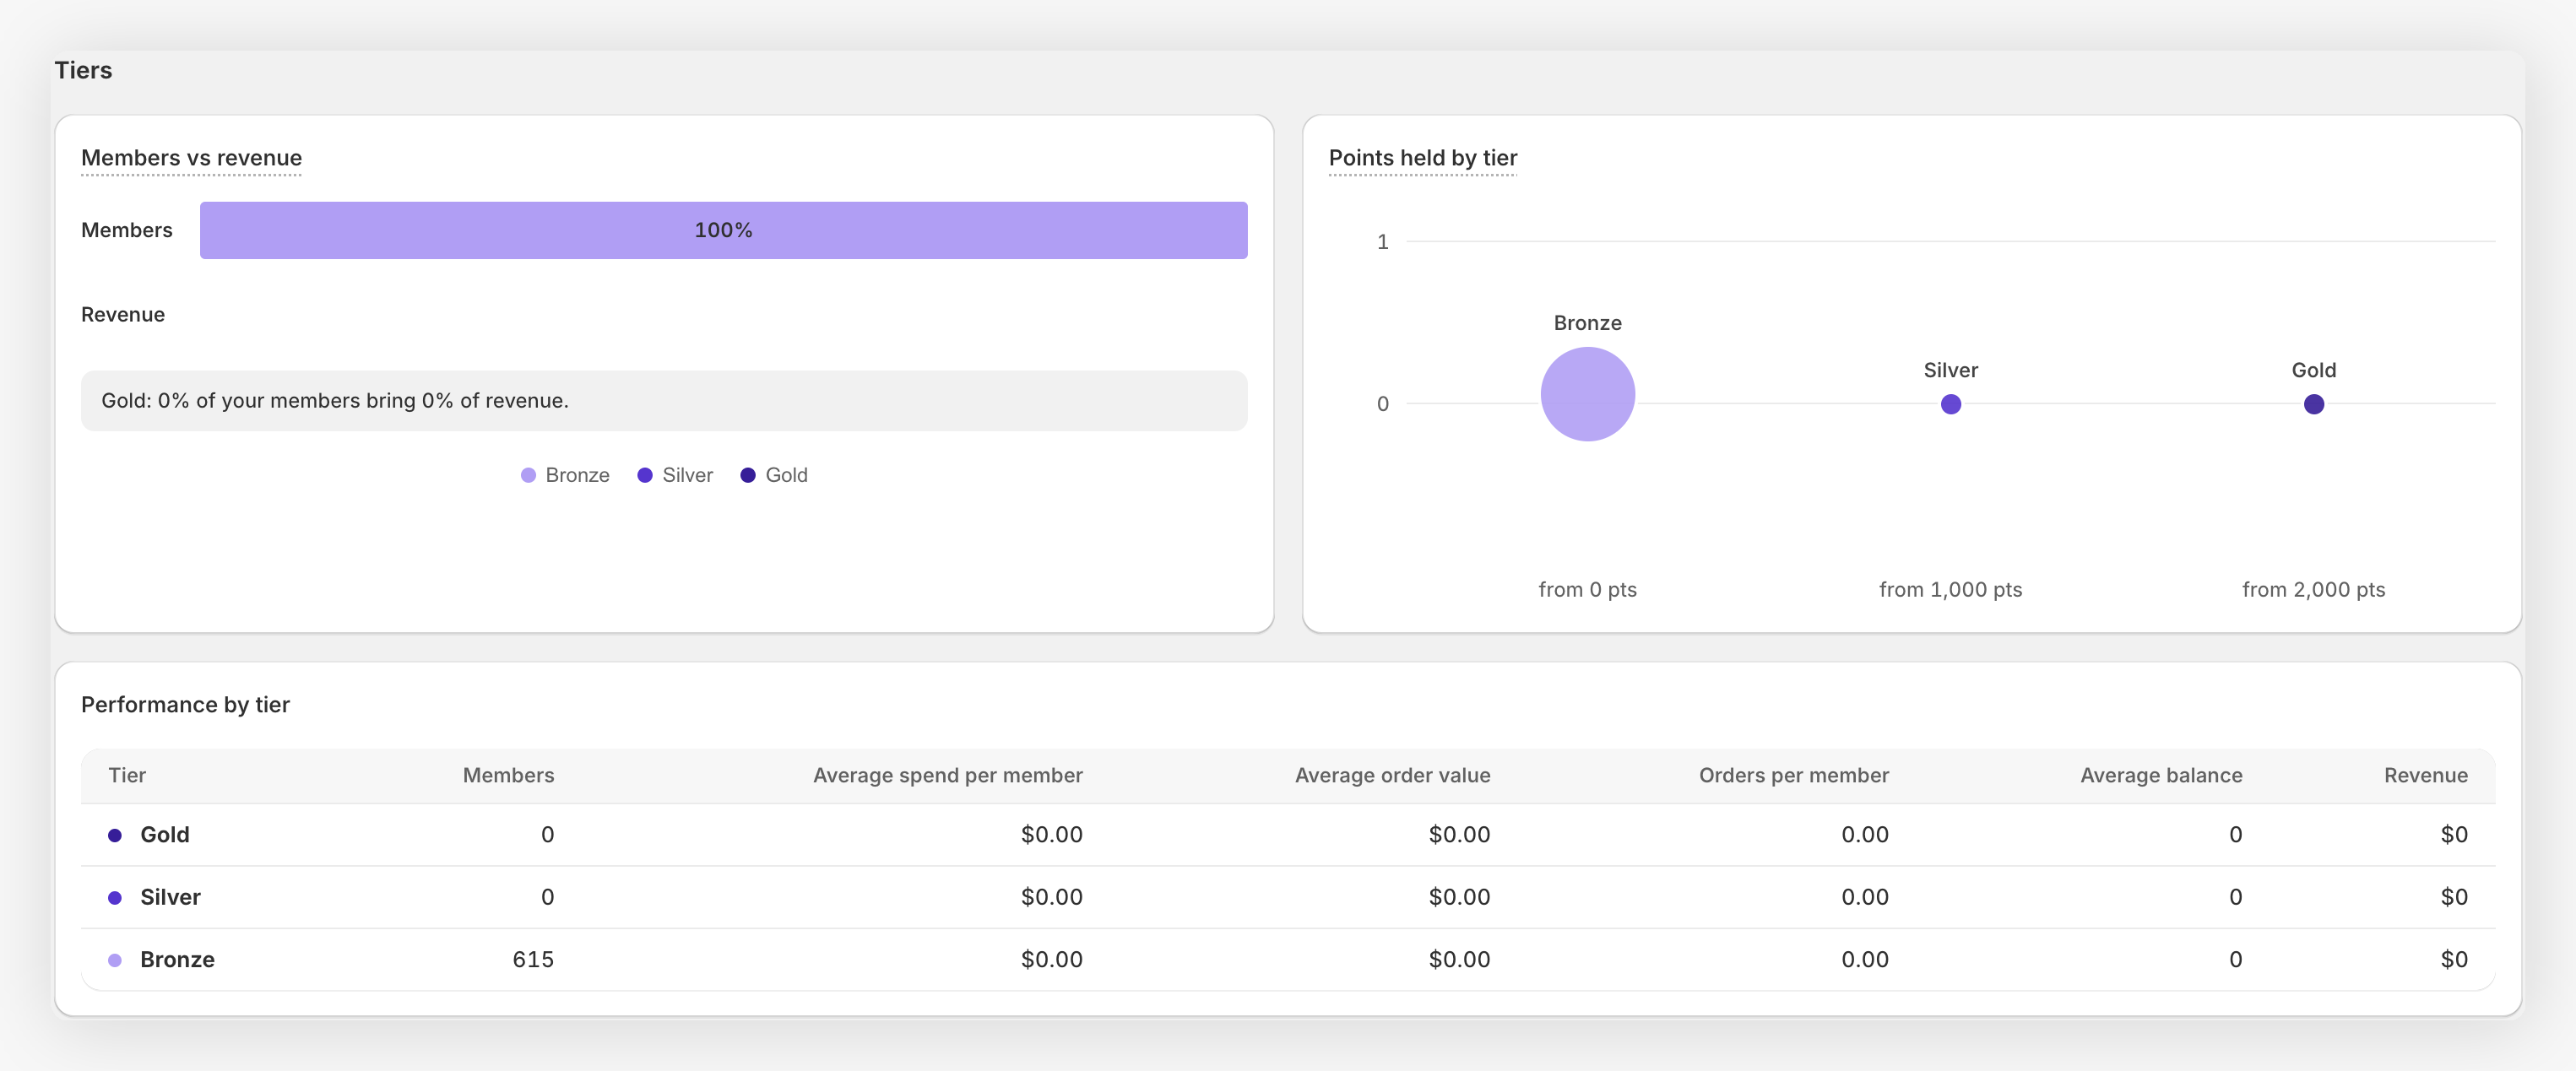
If you use VIP tiers, this section compares members and revenue across tiers and shows the points each tier holds. It uses each member's current tier, even when you look at a past period.
Most redeemed rewards lists your rewards by redemptions. Estimated value is the face value of the discounts we can value, minus identified refunds. Percentage discounts and free shipping show Not valued.
Review Overview once a month. If a signal appears, follow its link to act on it right away.